Results
Results of the pipeline are presented in the form of table. Additionally the pipeline generates plots that can be used to immediate inspection of the results. The pipeline during run generates many files. You can check the files generated at each step in the Pipeline flow section.
The file with results is called test/results_with_probability_annotated.tab. This is an example of the table generated by the run of test:
RNA18S      1805    1806    snoID_0145      35.0    +       -32.5   -2.362136710375476      T       ((((((((((((((((((((.&))))))))))))))))))))      0.9985874938860818      1806    NA      NA      NA      NA      NA
RNA28S      3722    3723    snoID_0051      297.0   +       -24.5   -0.8262461258511468     G       .((((((((((((((((.&.)))))))))))))))).   0.9820269187646468      3723    NA      NA      NA      NA      NA
RNA18S      461     462     snoID_0091      10.0    +       -26.6   -2.0974042420540084     C       ((((((((((((((.((.&.)).))))))))))))))   0.9769660814617612      462     NA      NA      NA      NA      NA
RNA18S      1030    1031    snoID_0038      15.0    +       -24.6   -1.5332765514685365     A       (((((((((((((((((.&.)))))))))))))))))   0.9764776374727128      1031    NA      NA      NA      NA      NA
RNA28S      390     391     snoID_0128      638.0   +       -22.6   -0.4628266825472744     A       .(((((((((((((.&.))))))))))))). 0.9730740226153078      391     NA      NA      NA      NA      NA
RNA18S      1271    1272    snoID_0080      24.0    +       -26.5   -3.0061575391125657     C       .((((((((((((.&.)))))))))))).   0.9729293415188028      1272    NA      NA      NA      NA      NA
RNA18S      467     468     snoID_0114      6.0     +       -25.5   -3.9820153772481808     A       (((((((((((((((.&.)))))))))))))))       0.970629236316464       468     NA      NA      NA      NA      NA
RNA18S      461     462     snoID_0064      11.0    +       -25.7   -2.040235979926924      C       ((((((((((((((.&.)))))))))))))) 0.9680243404065784      462     NA      NA      NA      NA      NA
RNA18S      461     462     snoID_0094      18.0    +       -25.7   -2.316104404986292      C       ((((((((((((((.&.)))))))))))))) 0.9680243404065784      462     NA      NA      NA      NA      NA
RNA18S      461     462     snoID_0124      1.0     +       -25.6   -2.2282206777051834     C       ((((((((((((((.&.)))))))))))))) 0.9668440616572168      462     NA      NA      NA      NA      NA
Columns:
| Column Number | Description |
|---|---|
| 1 | Chromosome |
| 2 | Start (0-based) |
| 3 | End (1-based) |
| 4 | snoRNA ID |
| 5 | Chmieras count |
| 6 | Strand |
| 7 | Interaction energy (PLEXY) |
| 8 | Log site specificity |
| 9 | Modified nucleotide |
| 10 | Interaction structure (PLEXY) |
| 11 | Interaction probability from the model |
| 12 | Modification position (1-based) |
| 13 | Genecode gene type eg. protein_coding |
| 14 | ENSEMBL ID |
| 15 | Gene name |
| 16 | Transcrip region eg. intron |
| 17 | mRNA region eg. five_prime_UTR |
Note
Log site specificity feature is not used to calculate probability. It is calculated ad a ratio between number of chimeric reads for specific positions and snoRNA with total number of chimeric reads for particular position.
Inspection of a run
In order to quick inspect the run use plots produced by the pipeline.
Score histogram
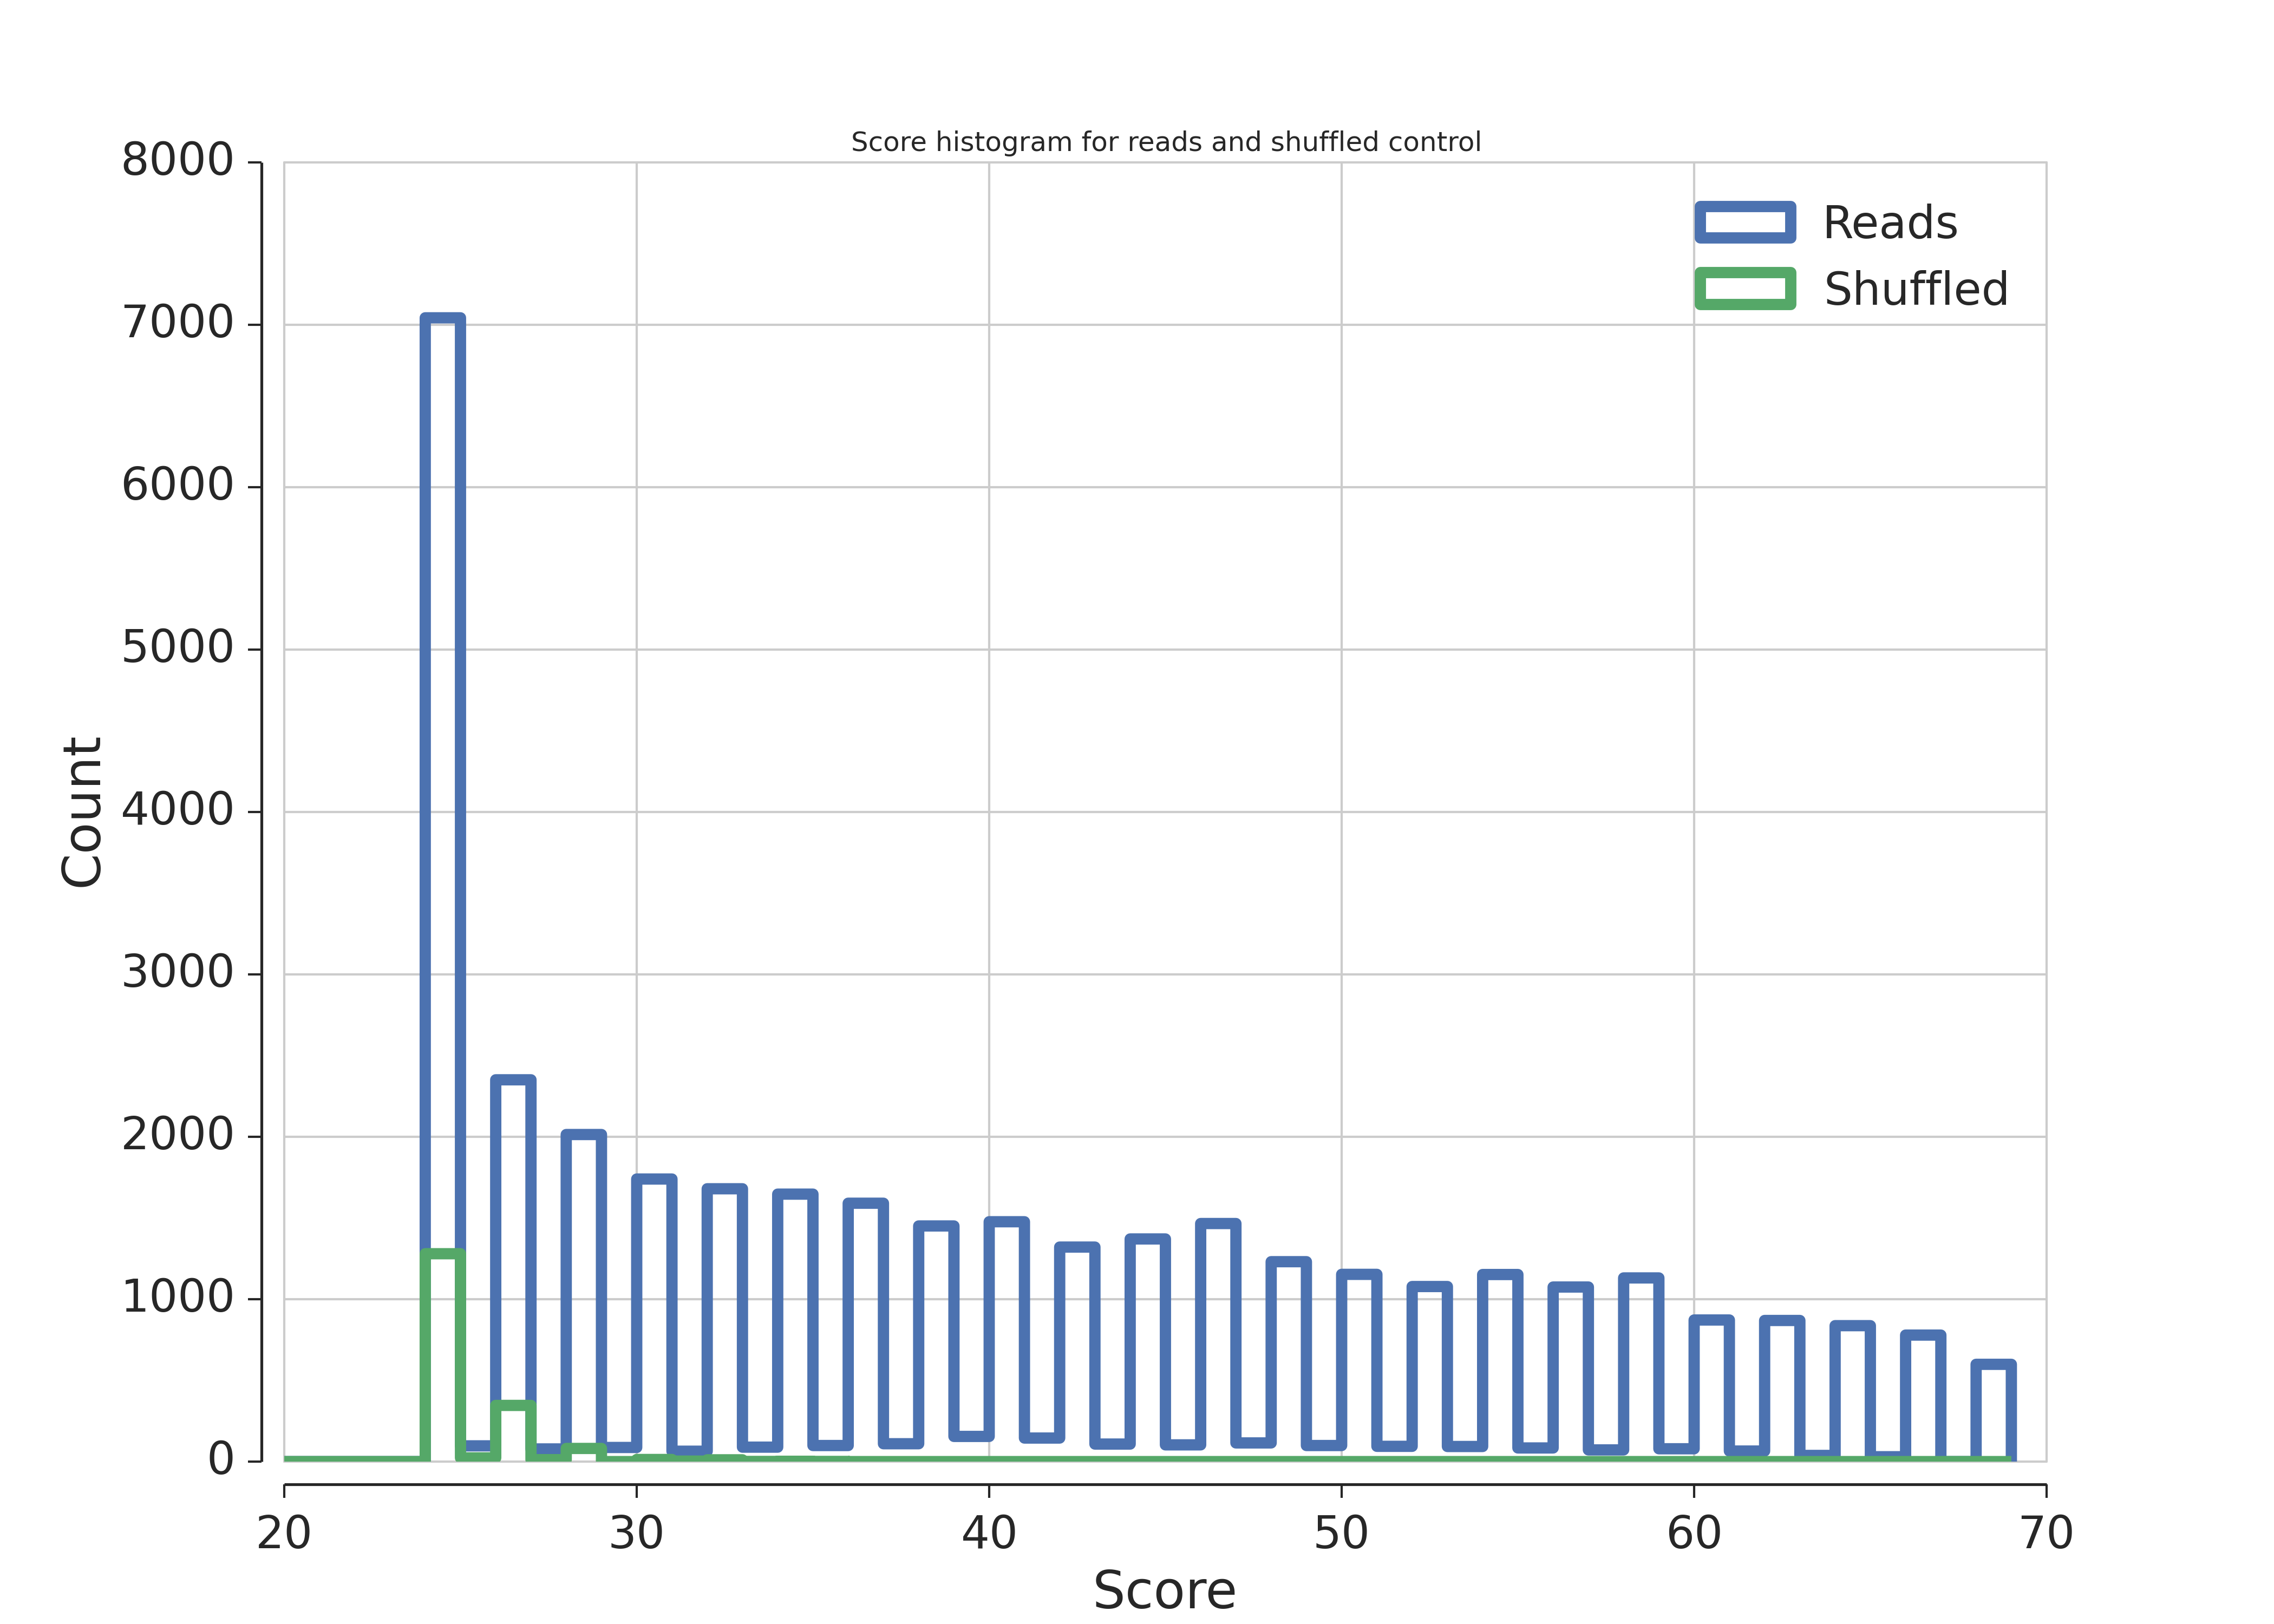
The distribution of the local alignment scores of unmapped reads to snoRNAs (blue) and the same reads shuffled using ushuffle (green).
As can bee seen in the figure scores for unshuffled reads are way highter than for shuffled ones. This indicates the enrichment of snoRNAs in reads.
Read profiles
One can also check the profile of the split chimeras that map to particular target RNA along its sequence.
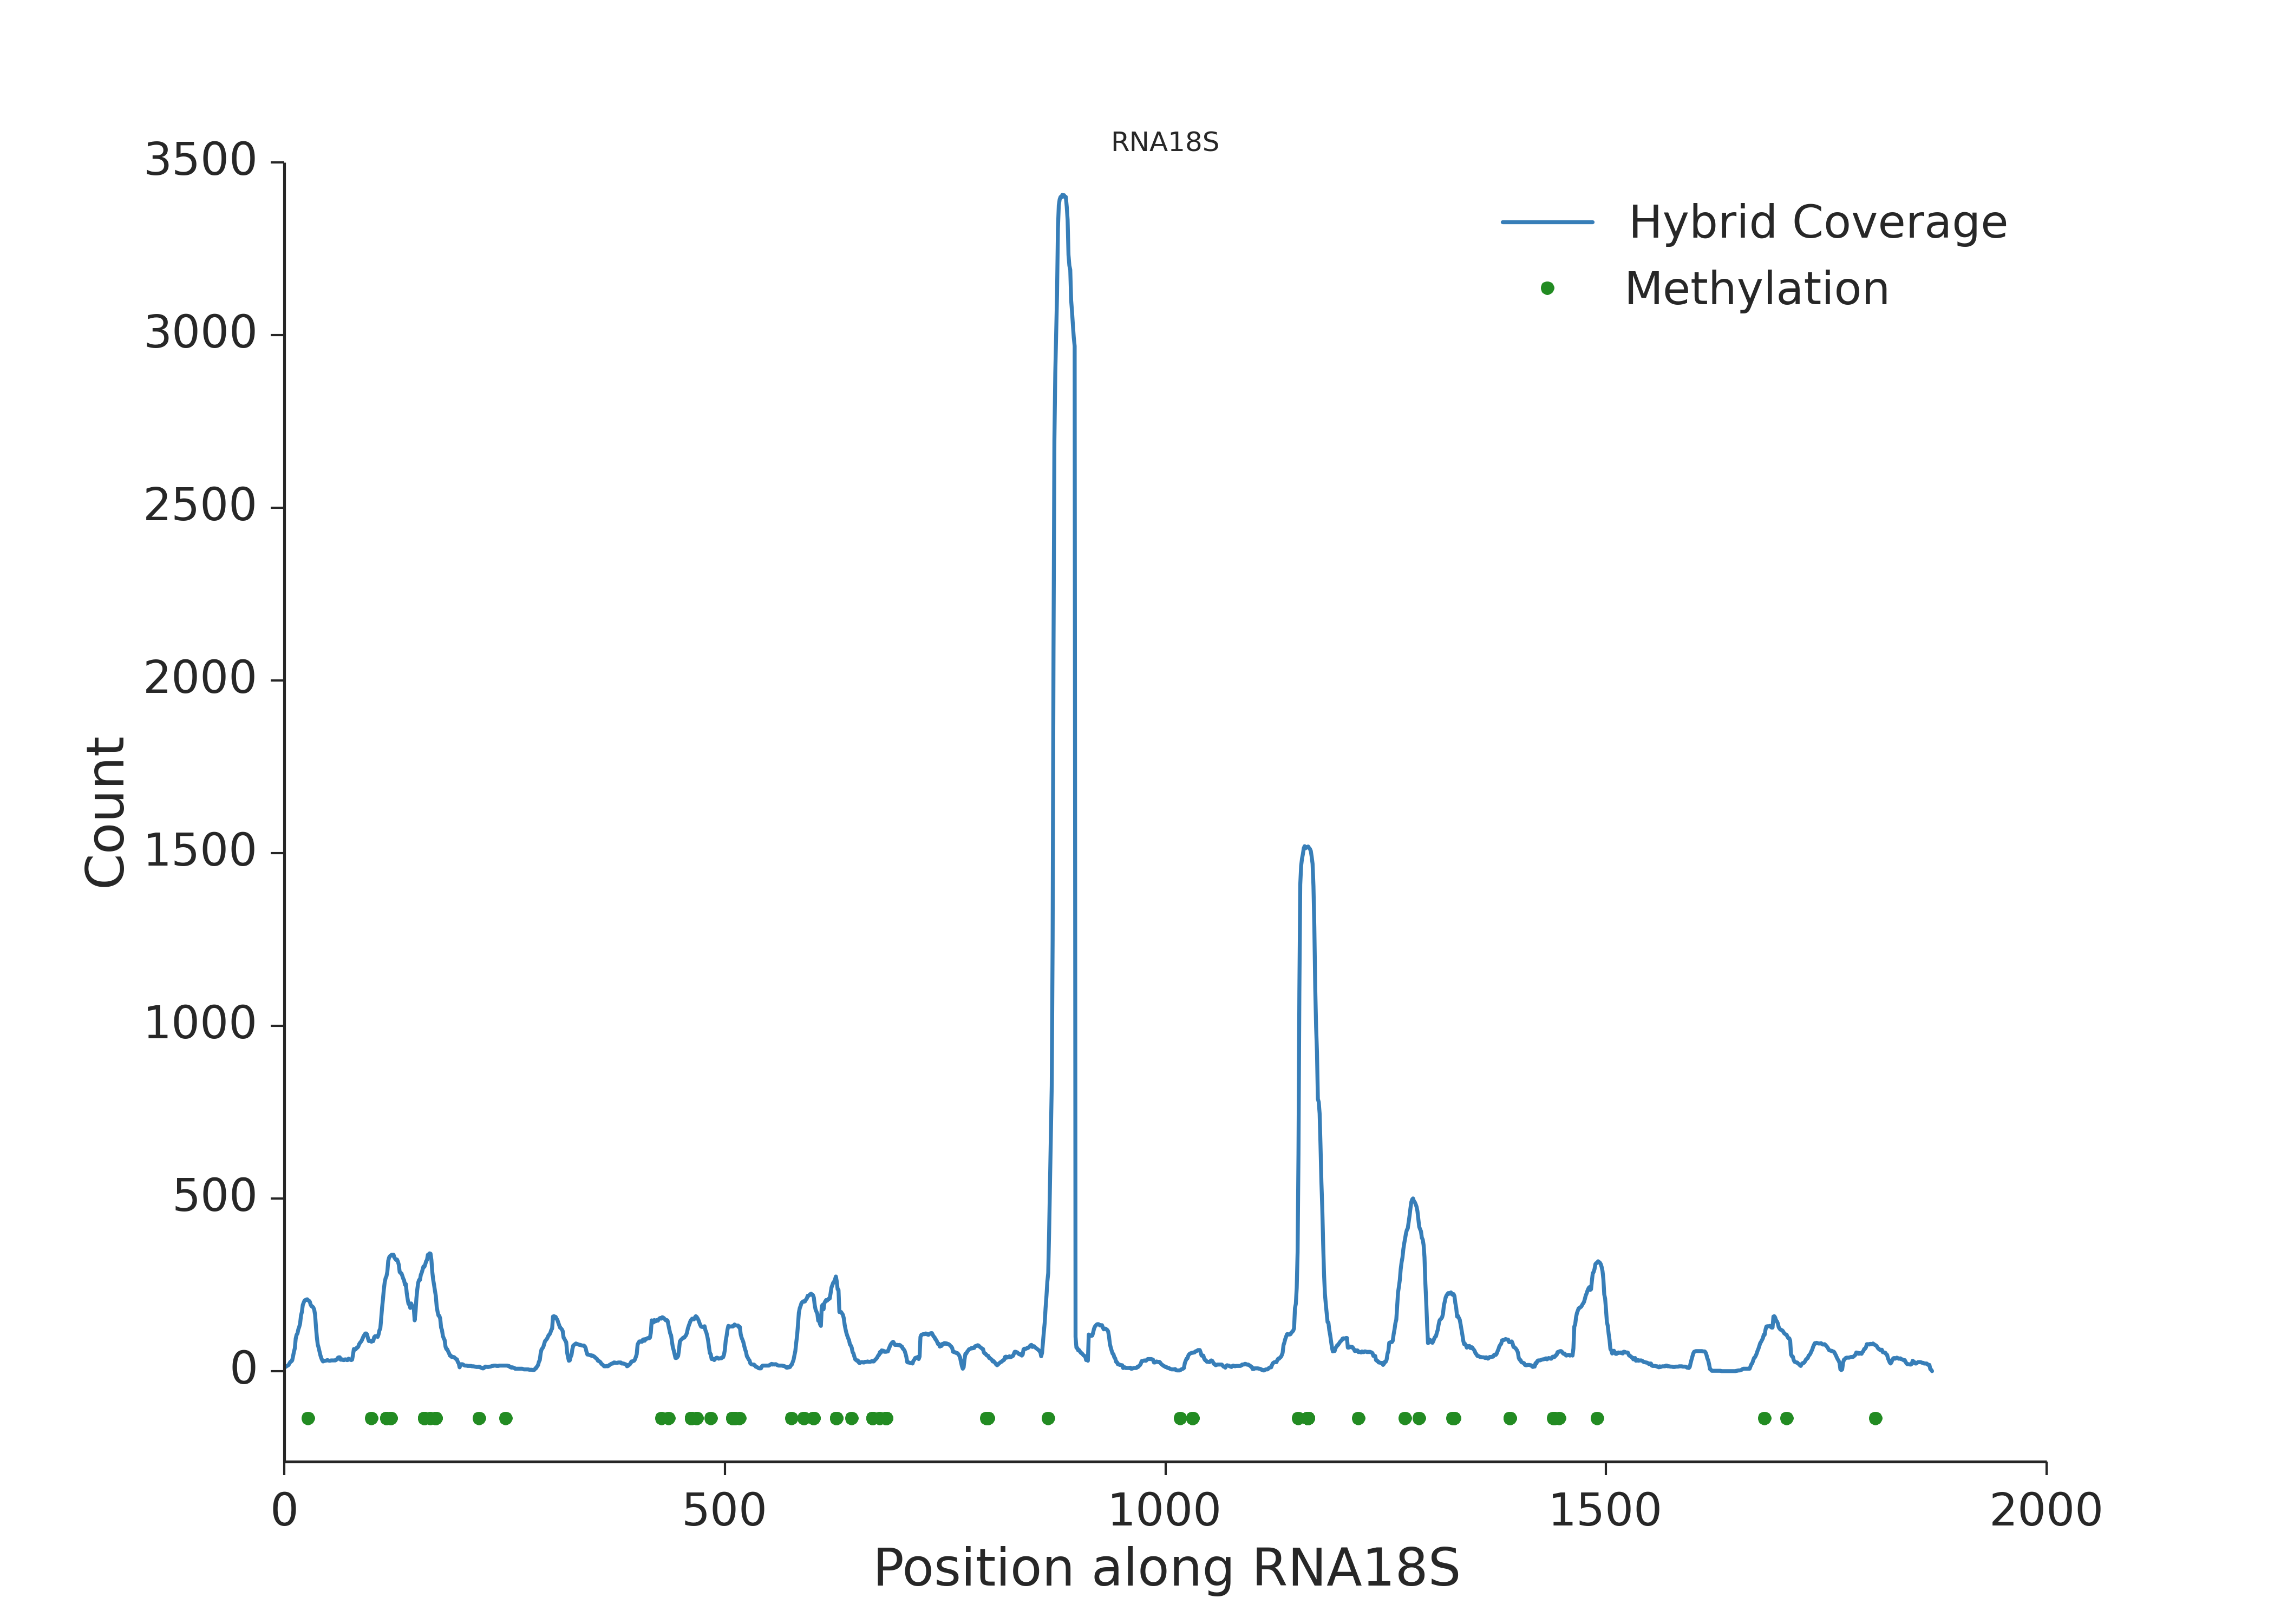
Profile (nucleotide count) along 18S rRNA. Green dots represent 2’-O-methylations known from previous studies.
In order to see previous 2’-O-methylation positions they should be declared in the snoRNA table.
It can be seen that the spots with known modifications are covered by more chimeric reads.
Probabilities
Another important plot produced by the pipeline are the probabilities derived from model ploted for each nucleotide in the target RNA.
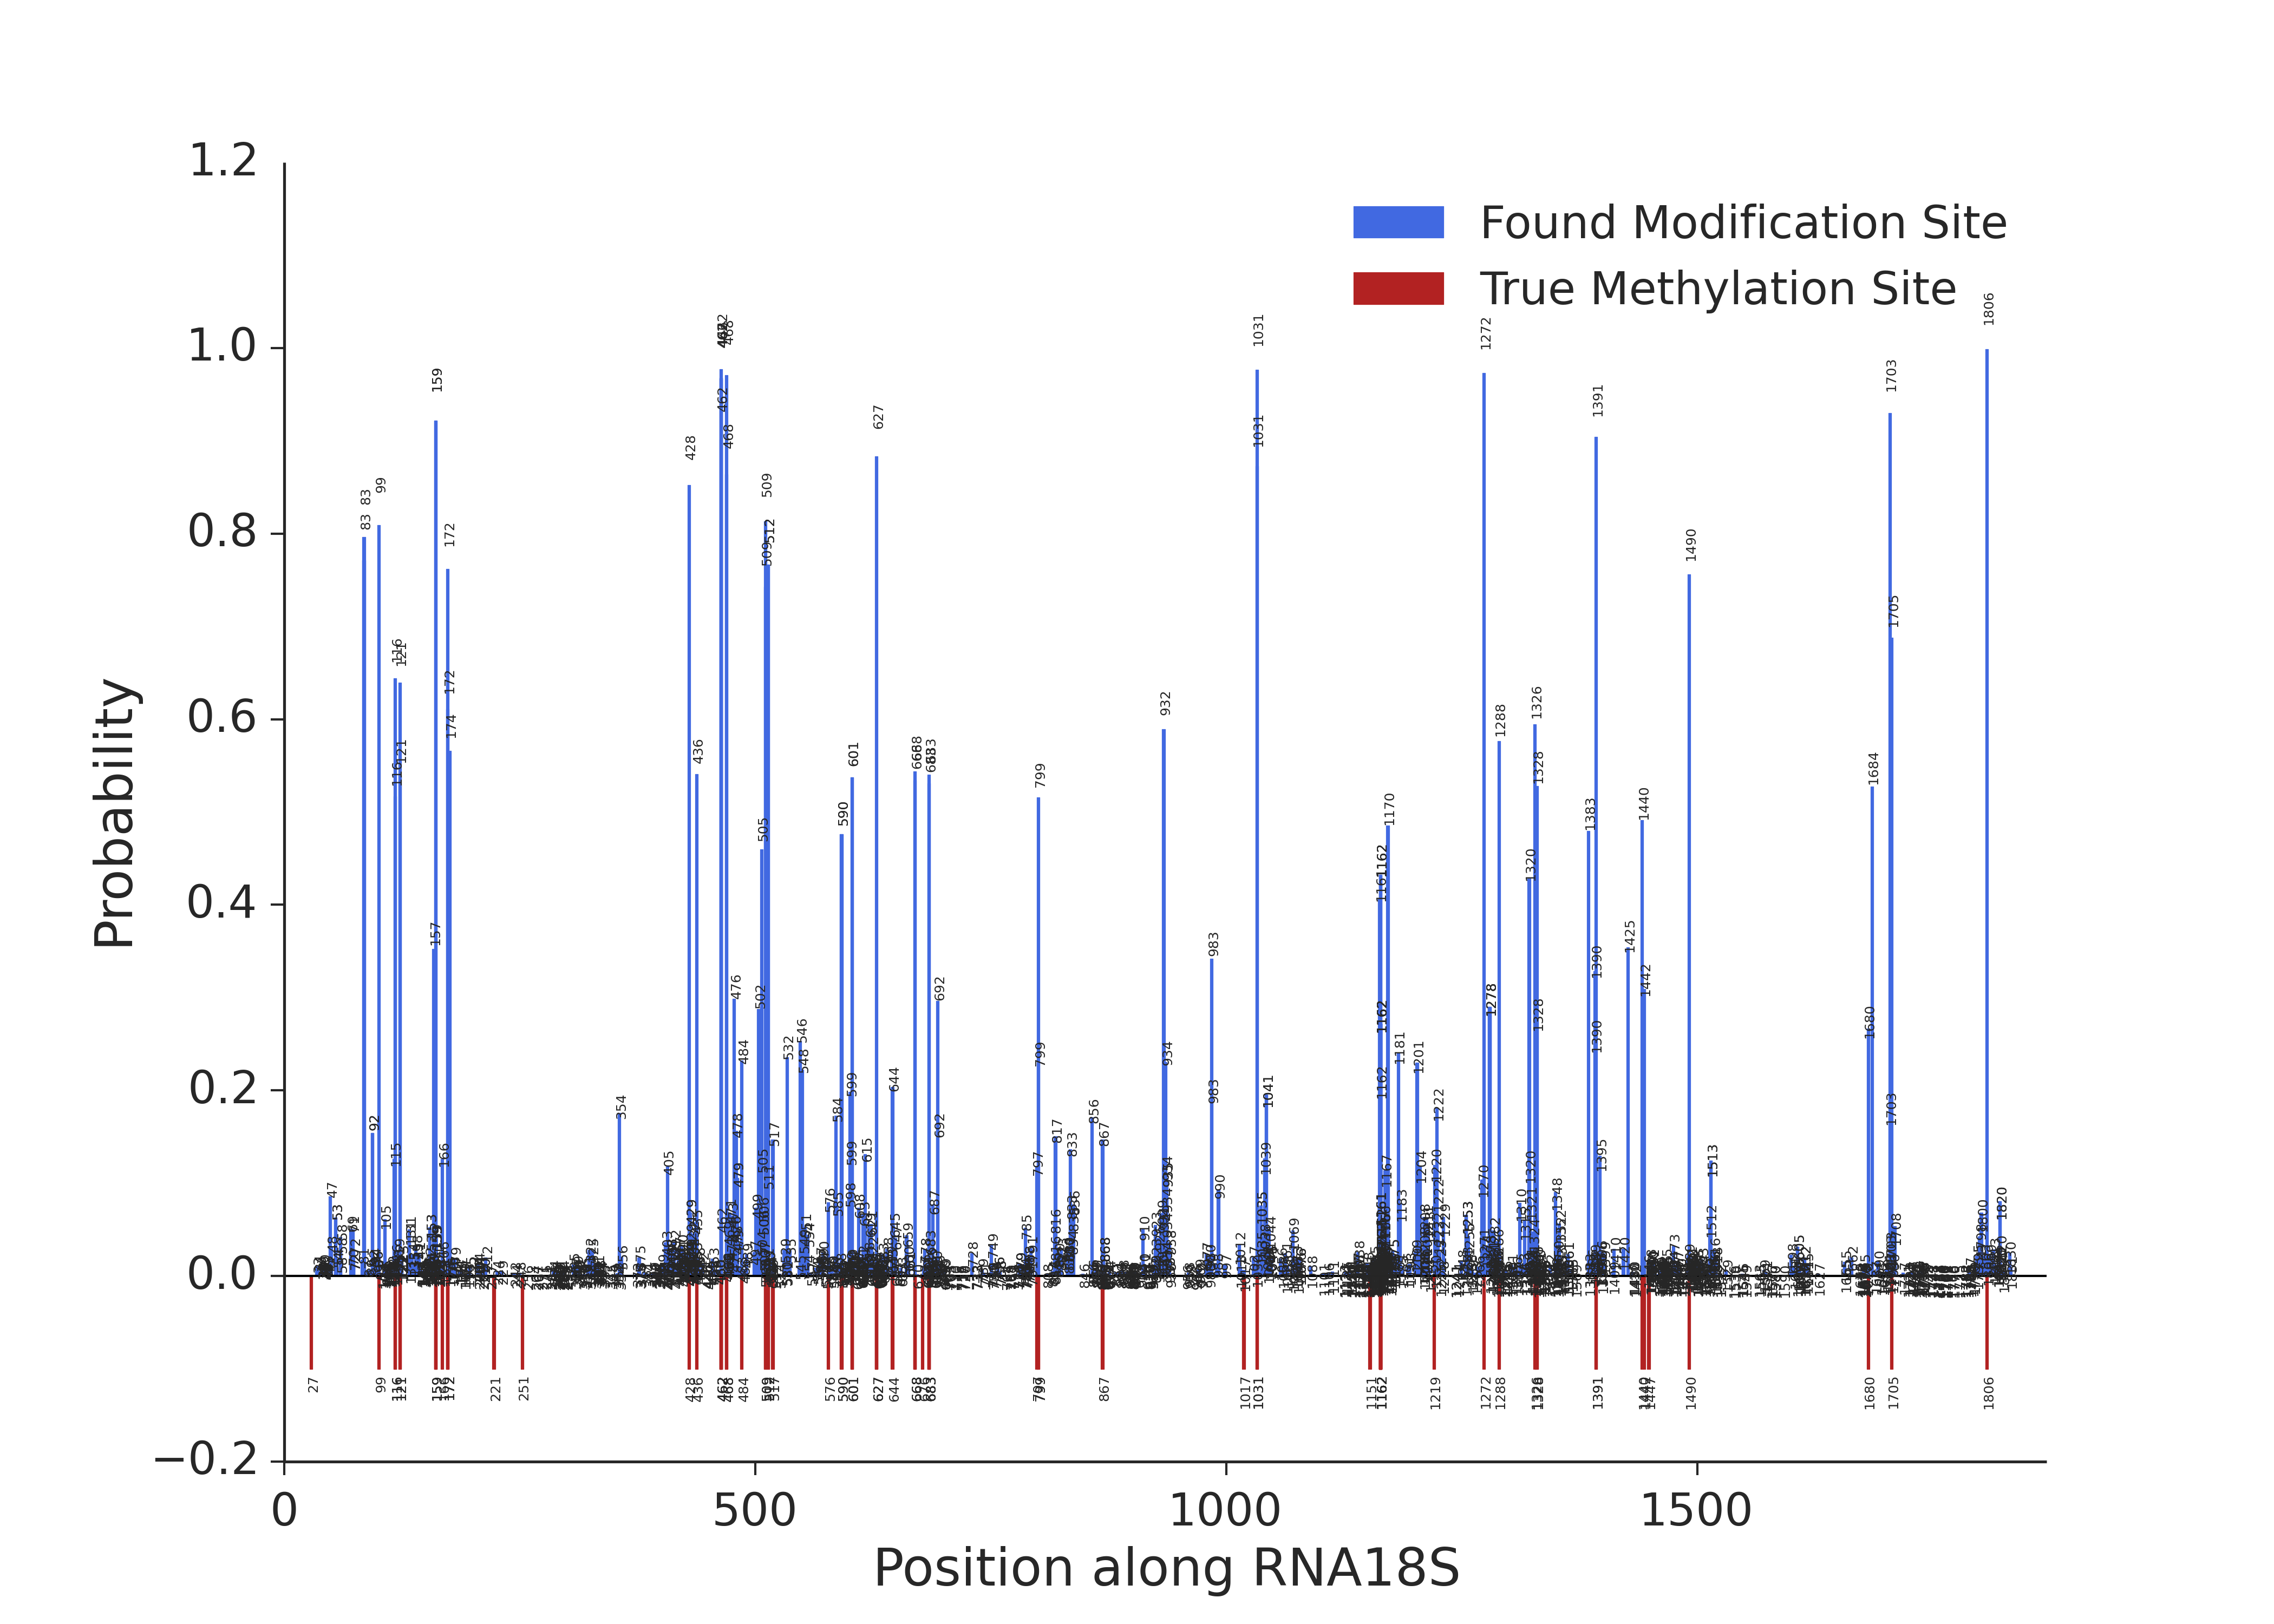
Probability calculated by the model along 18S rRNA. Red bars represent 2’-O-methylations known from previous studies.
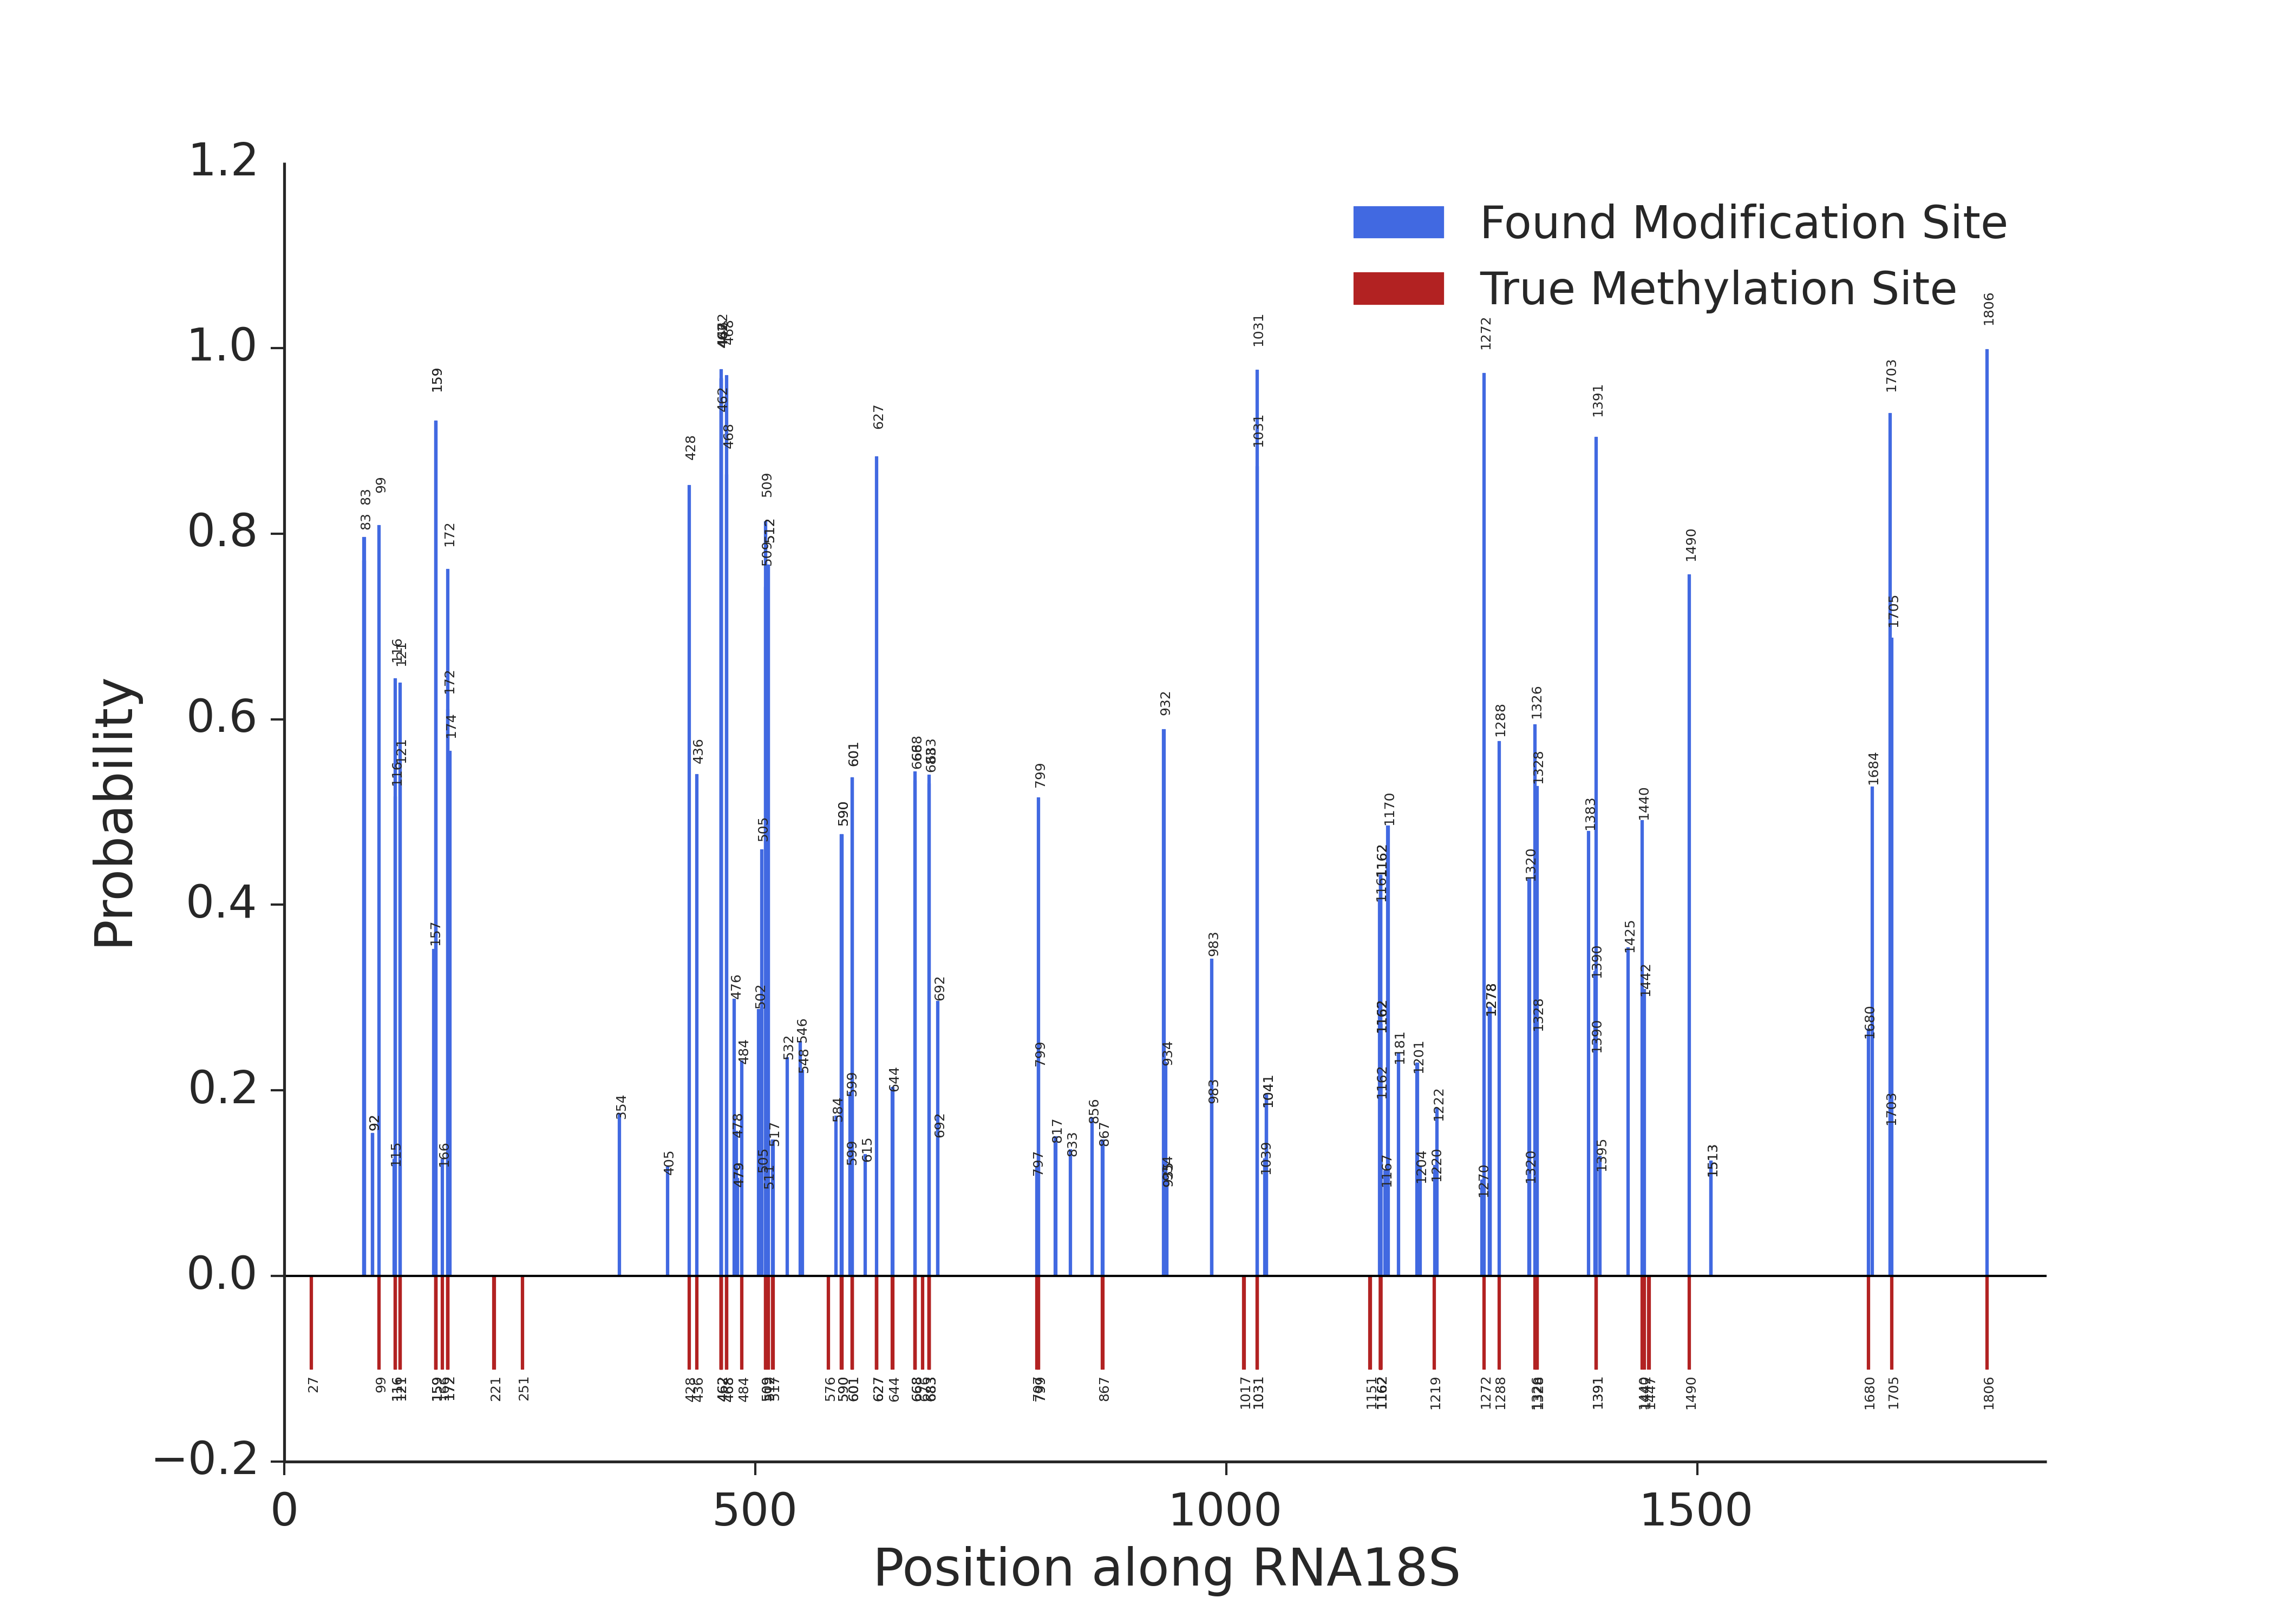
The same plot as previousely but with probabilities shown only for the positions on which the probability is higher than 0.1 (for clarity).
It can be immediately seen that the positions with knwon modification sites have higher probability values. Which indicates that the experiment is working as expected.
RNAduplex
RNAduplex part of the pipeline also produces its own results table. This can be used to investigate non-canonical interactions. The table is called results_with_RNAduplex_score_annotated.tab:
RNA18S      103     153     snoID_0159      1       +       0.0     NaN     NaN     NaN     NaN     0.0     82      0.426829268293  -28.20  -15.50  -24.10  ######################.((((((....((((((((((((((....(((((((..............(((((.####      23,78   1,48    ###############.(((((.(((.(((.(((((((((....(((...............((((.(((((.###     NA      NA      NA      NA      NA
RNA18S      141     191     snoID_0159      1       +       -9.6    .(((((((((.&.))))))))). GGTAAmTTCTAG&ATAGGATTACG        D       159     -8.9    82      0.426829268293  -20.60  -20.20  -22.10  ##########################.((((......(((.(((..(((........((((..(((((((((((.....((.      27,82   3,45    #########################.(((((((((((((((((.((((...(((  NA      NA      NA      NA      NA
RNA18S      288     338     snoID_0159      1       +       0.0     NaN     NaN     NaN     NaN     0.0     82      0.426829268293  -21.20  -27.90  -22.90  #######################.(((((((..(.(.((((...............(((.......((((...((((((.##      24,80   14,50   ################.((....(((((((.................((..(((..(((....((((((.((.##     NA      NA      NA      NA      NA
RNA18S      1243    1293    snoID_0159      1       +       0.0     NaN     NaN     NaN     NaN     -4.8    82      0.426829268293  -22.20  -13.90  -24.40  #.((((((........(((.....(((((.(....(.(((((.......................((....((.((((.###      2,79    3,50    ################################################################.(((((...((((..(((.(((.(((.##   NA      NA      NA      NA      NA
RNA18S      1255    1305    snoID_0159      1       +       0.0     NaN     NaN     NaN     NaN     -1.6    82      0.426829268293  -21.40  -20.10  -18.70  #.((((((..((.((.(((.....(((((.(....(.(((((.(.#####################################      2,45    5,46    #####################.(((.(((.((((...((.((.....((.(((((.........((((((((.       NA      NA      NA      NA      NA
Columns:
| Column Number | Description |
|---|---|
| 1 | Chromosome |
| 2 | Start (0-based) |
| 3 | End (1-based) |
| 4 | snoRNA ID |
| 5 | Chimera count |
| 6 | Strand |
| 7 | Interaction energy (PLEXY) |
| 8 | Interaction structure (PLEXY) |
| 9 | Interaction sequence (PLEXY) |
| 10 | Box |
| 11 | Modification position (1-based) |
| 12 | Interaction energy with random snoRNA (PLEXY) |
| 13 | snoRNA sequence length |
| 14 | GC fraction in snoRNA seuqnce |
| 15 | Interaction energy (RNAduplex) |
| 16 | Interaction energy with random snoRNA (RNAduplex) |
| 17 | Interaction energy with shuffled target sequence (RNAduplex) |
| 18 | Structure along snoRNA (RNAduplex) |
| 19 | snoRNA positions (RNAduplex) |
| 20 | Target positions (RNAduplex) |
| 21 | Genecode gene type eg. protein_coding |
| 22 | ENSEMBL ID |
| 23 | Gene name |
| 24 | Transcrip region eg. intron |
| 25 | mRNA region eg. five_prime_UTR |
RNAduplex is used as an alternative to PLEXY which is not bound to the specific snoRNA-target interaction. This part of the pipeline is used to generate a profile of bound/unbound positions along given snoRNA based on the column 18 (Structure along snoRNA) of the clustered RNAduplex results. One can view these plots as an aggregation of RNAduplex-calculated structures for each snoRNA-target chimeric pairs.
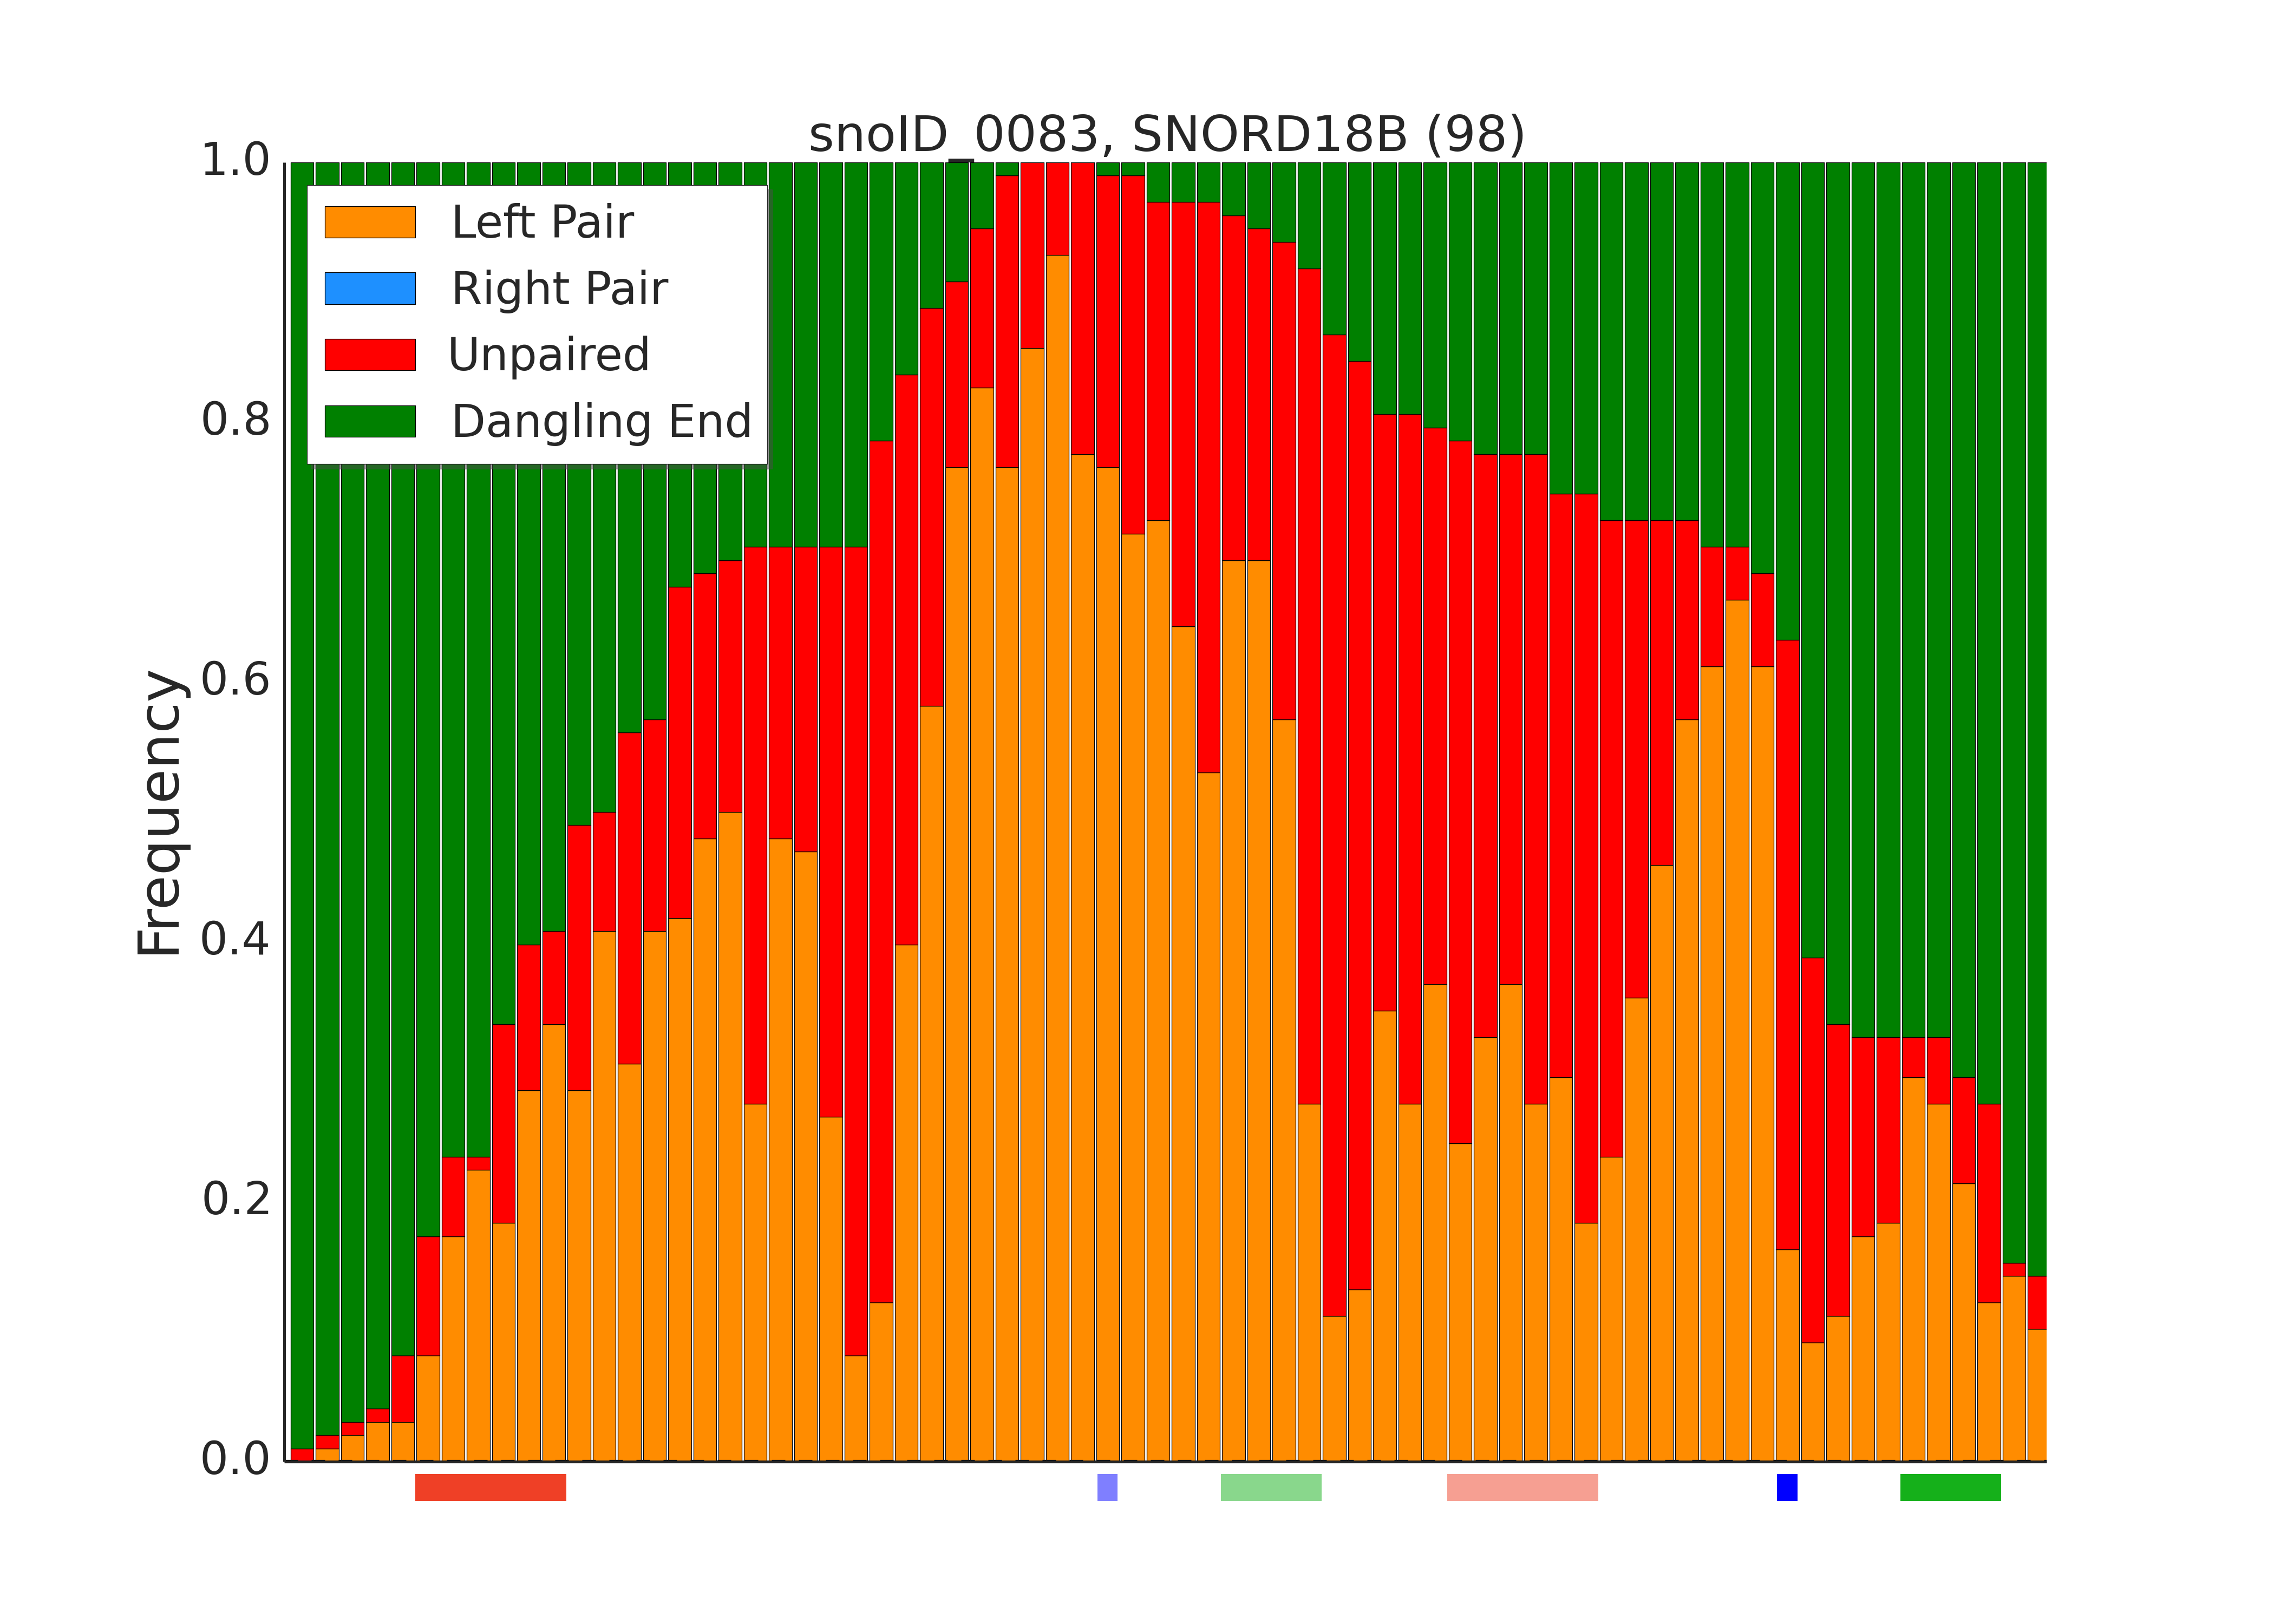
Fraction of structures in which given position was bound/unbound to the target along snoRNA calculated by RNAduplex.